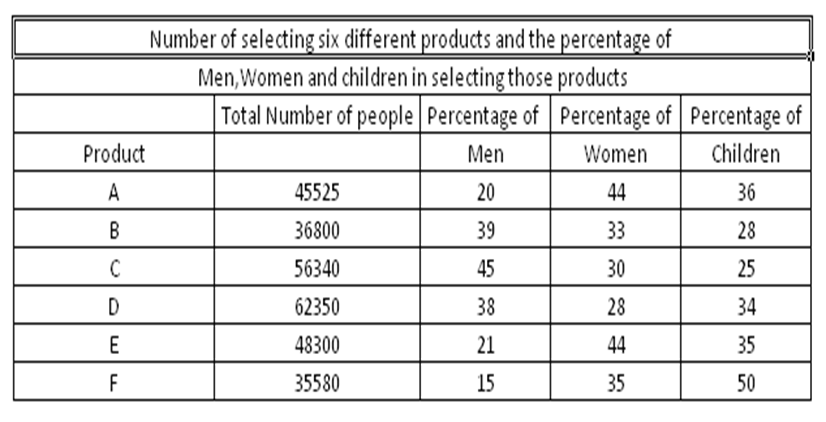
Total number of women selecting all the products together
= (45525 x 44/100) + (36800 x 33/100) + (56340 x 30/100) + (62350 x 28/100) + (48300 x 44 / 100) + (35580 x 35/100)
= 20031 + 12144 + 16902 + 17458 + 21252 + 12453
= 100240
Therefore Required average
= 100240 / 6
= 16707
Workspace
NA
SHSTTON
1
Solv. Corr.
1
Solv. In. Corr.
2
Attempted
0 M:0 S
Avg. Time
433 / 475
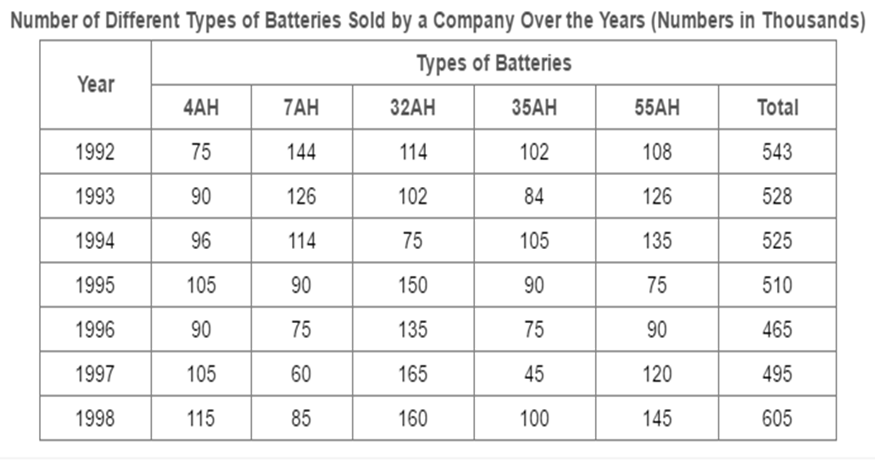
Study the following table and answer the questions based on it.
What is the total number of children selecting product A?
Number of men selecting product C = 56340 x 45 / 100 = 25353
Number of men selecting product F
= 35580 X 15/100 = 5337
Therefore Required percentage
= 5337 / 25353 x 100
= 21.05
Workspace
NA
SHSTTON
0
Solv. Corr.
2
Solv. In. Corr.
2
Attempted
0 M:0 S
Avg. Time
436 / 475
Study the following table and answer the questions based on it.
609. What is the respective ratio of total number of men selecting product B to those selecting product E
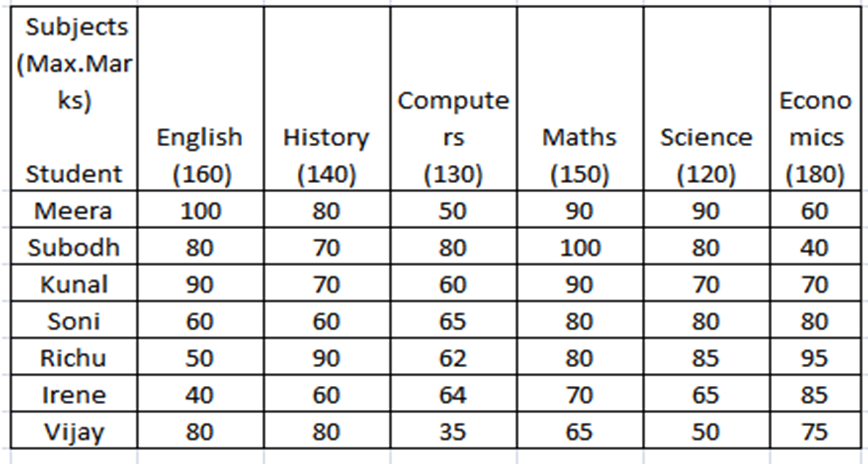
Average marks of all students in History = Total marks of all students in History / No. of students
= (80 + 70 + 70 + 60 + 90 + 60 + 80) / 7
= 510 / 7
= 72.86.
Data Interpretation Table Chart Questions and Answers pdf
At Data Interpretation topic Table Chart page No: 44 you will find list of 10 practice questions, tips/trick and shortcut to solve questions, solved questions, quiz, and download option to download the whole question along with solution as pdf format for offline practice. You can practice all the listed Data Interpretation Table Chart topic questions offline too, by downloading the MCQs practice question of Table Chart with detail solution, with formula/Tips & Tricks, with Solved examples and with top-rated users answers, which will give you best answer ascross webs. It is one of the perfect Table Chart e-book pdf covering all types of questions in detail. These Data Interpretation test with answers pdf cover all types of question asked in IIFT, XAT, SNAP, GRE, GMAT, NMAT, CMAT, MAT or for IT companies written exam like Wipro, HCL, Infosys, Accenture, Government exams, IBPS Exams etc. There are multiple formats to download your online free Data Interpretation Table Chart e-book, like fully solved, unsolved questions with Answers sheet. Even you can customize your ebook format by adjusting the given options in the download section to make it your one of the best Data Interpretation topic-based ebook. It is recommended to bookmark this page Data Interpretation Table Chart for your preparation. Most of the students and fresher candidates finding it hard to clear the Data Interpretation section in exams. Here Given Table Chart practice questions, quiz, fully solved questions, tips & trick and Mock tests, which include question from each topic will help you to excel in Table Chart. Each test has all the basics questions to advanced questions with answer and explanation for your clear understanding, you can download the test result as pdf for further reference.
At Data Interpretation topic Table Chart, you will get multiple online quiz difficulty wise, which will have a total of 6 quizzes, categorized as easy, medium, and moderate level. While preparing for any Table Chart, take all the list quiz and check your preparation level for that topic. Each quiz have 10 different question, which needs to be answered in 20 min., all the listed quiz here is free, however, you will get only one chance for each quiz to attempt(Take Quiz seriously), so it is always recommended to take one quiz in each section before you start solving Table Chart MCQs practice question, and one after solving all the question of the respective level, you can refer back your Table Chart quiz result any time or you can download it as pdf for reference.
Data Interpretation Table Chart Customize Online Mock Test
This is own type of mock test, where At this Data Interpretation Table Chart MCQs mock test section, you will able to attempt only the questions related to Table Chart, in that question will be a different level, important, and all the questions will be part of some of the mock tests across Q4interview FREE Mock test. You need to choose the topic as Table Chart, and click on Double click to generate your customize mock test. While attempting the mock test you need to choose any of the one options out of given option. It is recommended to go through the direction given along with each question, as these questions will be randomly and so that same direction will not be applicable across the entire test. Once you submit your mock test, the result will be generated for Table Chart Customize mock test, where your performance point points will be highlighted. Q4interview analysis every single point which helps you to improve your topic understanding and help you to know your type of mistakes and way to improve Table Chart questions, by providing the same type of practice questions from practice exercise.
The best part of this Table Chart, all these mock tests listed here are free and you can take as Many time, as many you want. When you continue to give Table Chart Customize Online Mock Test here regularly, then you will understand how much you have developed your accuracy on a topic, after that you will be able to decide how much attention you need to focus on. Your continued practice will increase your confidence, speed and thinking ability intensely, the Table Chart Customize topic on which you will practice more will beneficial for you in future during campus placement.Table Chart Mock Tests
Data Interpretation Table Chart Quiz Online Test
The details of the Data Interpretation Table Chart quiz are as follows. There are 10 questions for you. You have to answer them in 20 minutes. Within 20 minutes you have to see the errors in the sentences given as a question. Four options are also given to you, and you have to choose your opinion. You must be confident in your answer that the choices are difficult. Therefore, below we provide you with some information about Data Interpretation Table Chart that you see and keep them in mind while answering questions.
Data Interpretation Table Chart MCQs Practice Questions with Answer
On this Table Chart section of page you will find the easiest quickest ways to solve a question, formulas, shortcuts and tips and tricks to solve various easiest methods to solve Table Chart Question Quickly. It contains all the Data Interpretation topic Table Chart questions which are common in any of the preliminary exams of any company. The solution is provided along with the questions. The practice of these questions is a must as they are easy as well as scoring and asked in all the exams They will confirm the selection if all the questions attempted wisely with little practice. It is recommanded to Take Mock test based on Data Interpretation topic and Table Chart topic based quiz.
Data Interpretation Table Chart solved examples question
Clarity of concepts is a must if you want to master the skill of solving Data Interpretation problems. This page contains sample Data Interpretation Table Chart questions and answers for freshers and competitive exams. Table Chart Questions with the detailed description, the explanation will help you to master the topic. Here solved examples with detailed answer description, explanations are given and it would be easy to understand. How to solve qTable ChartData Interpretation? Here are some examples solved with the Common Rules/tricks/tips of Data Interpretation. Enhance your chance to score maximum marks in Data Interpretation sections through. Error Spotting Grammar Questions Online Test for Free. Fully solved Sentence Formation MCQs questions with detailed answer description. Data Interpretation is an important topic for any exams but most aspirants find it difficult. You need to learn various tricks tips, rules, etc to solve quickly. At this page, you will find frequently asked Table Chart questions or problems with solutions, shortcuts, formulas for all-important competitive exams like IT companies exams, interviews. It is always a best practice to go through the example and understand the types of question and way to solve it, so let's do some examples to calculate efficiency, read through all the given here solved examples. You can post your solution, tips, trick and shortcut if you have any in respect to questions.
You can get here fully solved Table Chart examples with a detailed answer and description. You can solve Table Chart problems with solutions, the questions by companies wise by filtering the questions, additionally, you can check what type of questions are being asked in IT companies Written Round from Table Chart. Table Chart became one of the most important sections in the entire competitive exams, Companies Campus, and entrance online test. Go through Table Chart Examples, Table Chart sample questions. You can Evaluate your level of preparation in Table Chart by Taking the Q4Interivew Table Chart Online Mock Test based on most important questions. All the Table Chart practice questions given here along with answers and explanations are absolutely free, you can take any number of time any mock Test.
Why Data Interpretation Table Chart?
In this practice section, you can practice Data Interpretation Questions based on "Table Chart" and improve your skills in order to face the interview, competitive examination, IT companies Written exam, and various other entrance tests (CAT, GATE, GRE, MAT, Bank Exam, Railway Exam etc.) with full confidence.
Where can I get Data Interpretation Table Chart questions and answers with explanation?
Q4Interview provides you lots of fully solved Data Interpretation (Table Chart) questions and answers with Explanation. Solved examples with detailed answer description, explanation are given and it would be easy to understand. You can download Data Interpretation Table Chart quiz questions with answers as PDF files and eBooks.
Where can I get Data Interpretation Table Chart Interview Questions and Answers (objective type, multiple-choice, quiz, solved examples)?
Here you can find objective type Data Interpretation Table Chart questions and answers for interview and entrance examination. Multiple choice and true or false type questions are also provided.