Data Interpretation :: Line Chart - Discussion
Home > Data Interpretation > Line Chart > MCQs Questions Discussion
7 / 40
Study the following graph carefully and answer the following questions Cotton manufactured by cotton mill in the span of 2000 - 2005.
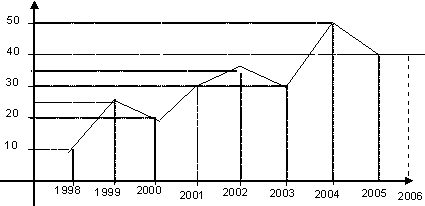
Qs.2/5: The production of cotton in 2000 is what percentage of production of cotton in 2001
A33.33
B66.66
C49.8
DNone of these
Answer: Option (Login/Signup)
Show Explanation
Asked In ::
No Discussion on this question yet!

