Data Interpretation :: Line Chart - Discussion
Home > Data Interpretation > Line Chart > MCQs Questions Discussion
4 / 40
Following Graph shows the exports of a country in crores in the different months of the year 2000 - 2001 and 2001 - 2002. Study the following graph and answer the question given below:
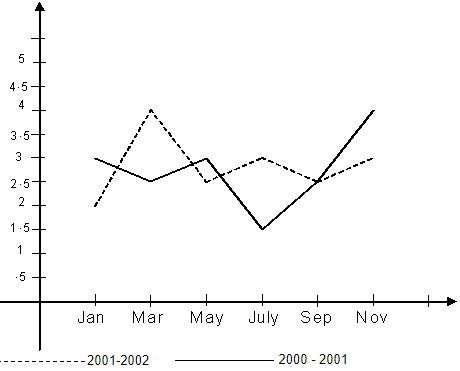
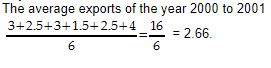
Qs.4/5: What was the average exports of the year 2000 to 2001
A1.4
B2.6
C3.8
D4.1
Answer: Option (Login/Signup)
Show Explanation