Data Interpretation :: Line Chart - Discussion
Home > Data Interpretation > Line Chart > MCQs Questions Discussion
3 / 40
Following Graph shows the exports of a country in crores in the different months of the year 2000 - 2001 and 2001 - 2002. Study the following graph and answer the question given below:
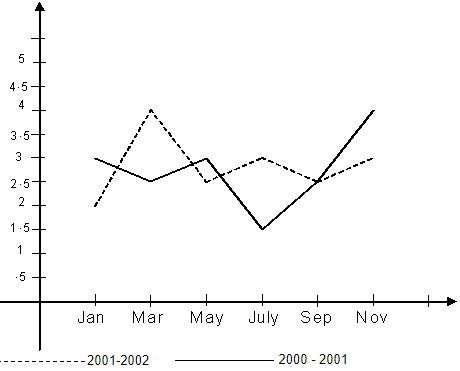
Qs.3/5: In which of the following pairs of months the difference between the value of exports is found to be 2 crores
AMarch, May
BSep, Nov
CMay, July
DJan, March
Answer: Option (Login/Signup)
Show Explanation
Asked In :: SSC CGL Tier I
No Discussion on this question yet!
