Data Interpretation :: Bar Charts - Discussion
Home > Data Interpretation > Bar Charts > MCQs Questions Discussion
25 / 450
Study the following Bar Graph carefully and answer the questions given below it.
Question: In which of the following year maximum % students appeared for IIT Examination
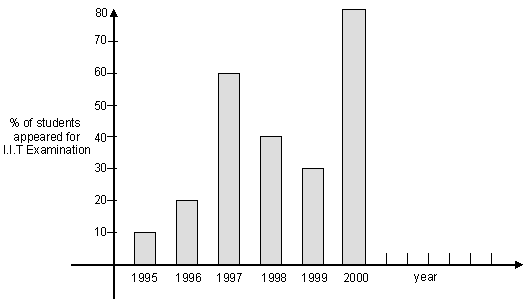
A1997
B2000
C1995
D1998
Answer: Option (Login/Signup)
Show Explanation
Asked In ::
No Discussion on this question yet!

