Data Interpretation :: Bar Charts - Discussion
Home > Data Interpretation > Bar Charts > MCQs Questions Discussion
19 / 450
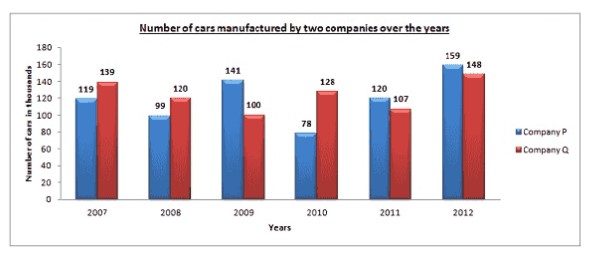
Study the following graph and answer the questions based on it.
Question: The production of Company Y in 2000 was approximately what percent of the production of Company X in the same year ?
A173
B164
C132
D97
Answer: Option (Login/Signup)
Show Explanation
Asked In ::
No Discussion on this question yet!
