Data Interpretation :: Bar Charts - Discussion
Home > Data Interpretation > Bar Charts > MCQs Questions Discussion
18 / 450
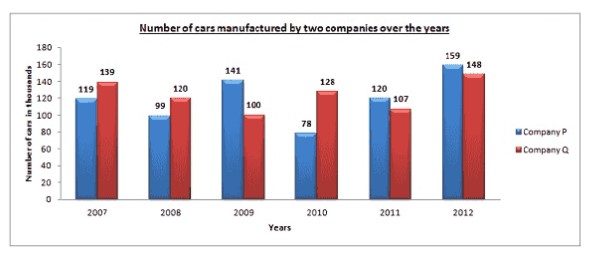
Study the following graph and answer the questions based on it.
Question: In which of the following years, the difference between the productions of Companies X and Y was the maximum among the given years ?
A1997
B1998
C1999
D2000
Answer: Option (Login/Signup)
Show Explanation
Asked In ::
No Discussion on this question yet!
