Data Interpretation :: Pie Charts - Discussion
Home > Data Interpretation > Pie Charts > MCQs Questions Discussion
14 / 671
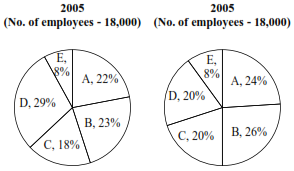
In which Dept. is the variation in strength the maximum in 2006?
AA
BB
CD
DE
Answer: Option (Login/Signup)
Show Explanation
Asked In ::
STEP-BY-STEP
It can be easily seen from the pie that maximum variation is in D i.e 29-20=9%
Read Full Answer

Report Error
Please Login First Click Here
