Data Interpretation :: Bar Charts - Discussion
Home > Data Interpretation > Bar Charts > MCQs Questions Discussion
10 / 450
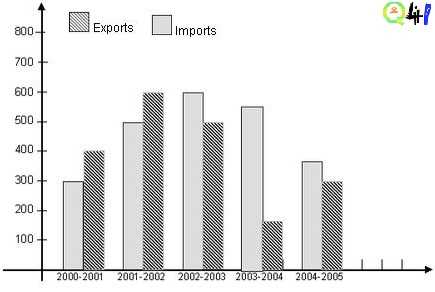
Directions (1-5) : The following questions are based on the given below the bar graph of Imports and exports of a country from 2000-2001 to 2004-2005
In which of the following year the gap between the import and export was maximum.
A2003-2004
B2001-2002
C2002-2003
D2004-2005
Answer: Option (Login/Signup)
Show Explanation
Asked In ::
STEP-BY-STEP
difference in 2003-2004= 400
difference in 2001-2002=100
difference in 2002-2003=100
difference in 2004-2005= 100
So answer is year 2003-2004
Read Full Answer

Report Error
Please Login First Click Here
