Data Interpretation :: Pie Charts - Discussion
Home > Data Interpretation > Pie Charts > MCQs Questions Discussion
12 / 671
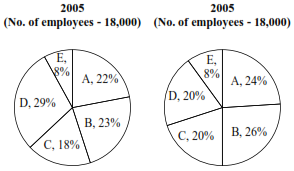
Direction (1-4): The following pie-charts gwe the pereeniage distribution of employees in different Departments in XYZ Company Ltd. during the years 2005 and 2006. Answer the questions using this data.
A-Administmlion; B-Operations: C-Sales & Marketing; D-Finance & Accocnts: E-Corporatc HQ
If the average monthly salary pf employees in Administration was Rs.12,000 in 2005. what was the approximate total salary expense of Administration in 2005?
ARs. 57 lakhs
BRs. 4.7 crores
CRs. 66 crores
DRs. 66 lakhs
Answer: Option (Login/Signup)
Show Explanation
Average salary was 12,000
So total salary= 12000* 3960=4.7 crores
Asked In ::
STEP-BY-STEP
In 2005 total people working in administration are 22% of 18000= 3960
Average salary was 12,000
So total salary= 12000* 3960=4.7 crores
Read Full Answer

Report Error
Please Login First Click Here

