Data Interpretation :: Bar Charts - Discussion
Home > Data Interpretation > Bar Charts > MCQs Questions Discussion
1 / 450
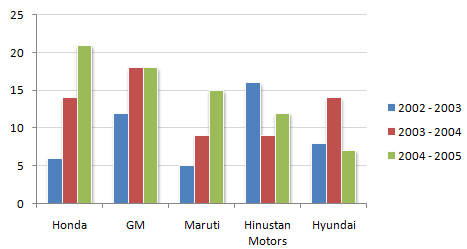
The following chart shows the production of cars in thousands.
Production of Cars for 2002 - 2005 period from the Selected Manufacturers
How many companies have shown production below their average production in 2002 - 2003, but have showed above the average production in 2003 - 2004 ?
AOne
BTwo
CThree
DFour
Answer: Option (Login/Signup)
Show Explanation
Asked In ::
No Discussion on this question yet!

